
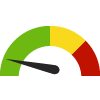
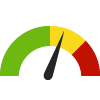
Indicator Gauge Icon Legend
Legend Colors
Red is bad, green is good, blue is not statistically different/neutral.
Compared to Distribution
 the value is in the best half of communities.
 the value is in the 2nd worst quarter of communities.
 the value is in the worst quarter of communities.
Compared to Target
 meets target;
  does not meet target.
Compared to a Single Value
 lower than the comparison value;
 higher than the comparison value;
 not statistically different from comparison value.
Trend

 non-significant change over time;
 significant change over time;
  no change over time.
Compared to Prior Value
 higher than the previous measurement period;
 lower than the previous measurement period;
 no statistically different change from previous measurement period.
 Significantly better than the overall value
 Significantly worse than the overall value
 No significant difference with the overall value
 No data on significance available
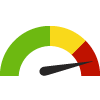
School Crime Incidents
Measurement Period: 2020
This indicator is archived and is no longer being updated. Click to learn more
This indicator shows the number of criminal offenses including attacks against school personnel, drug incidents, and firearm incidents reported by law enforcement officials. The offense need not have occurred on school grounds or during the academic school day.
Why is this important?
School crime, which can often involve violence or threats of violence (National Center for Education Statistics) [1], can disrupt learning and negatively impact students, schools, and the broader community (Centers for Disease Control and Prevention) [2]. School crime can include both student victimization and teacher victimization in the form of bullying, cyberbullying, violent deaths, school shootings, sexual violence, on-campus hate crime incidents, and nonfatal criminal victimization (U.S. Department of Education, Bureau of Justice Statistics) [3]. There is evidence that factors such as youth feeling connected to their schools, experiencing academic success, having positive relationships with teachers and other caring adults, and interacting with prosocial and nonviolent peers contribute to decreased aggressive behavior (Centers for Disease Control and Prevention) [4].
Considerations for Equitable Approaches: Data on school crime and discipline reflect differences in student experiences in U.S. public schools. Among K-12 students, sex, race, and sexual orientation were the most common basis for allegations of harassment and bullying (U.S. Department of Education) [5]. At postsecondary institutions, race, sexual orientation, and ethnicity were the three most frequently reported categories of bias motivating on-campus hate crimes (U.S. Department of Education, Bureau of Justice Statistics) [3]. When considering their overall enrollment, Black boys and girls, White boys, and boys of two or more races were overrepresented among K-12 students who were suspended or expelled. Students with disabilities were also overrepresented in discipline outcomes (U.S. Department of Education) [5].
84
incidents
Source:
Illinois State Police
Measurement period: 2020
Maintained by: Conduent Healthy Communities Institute
Last update: May 2022
Measurement period: 2020
Maintained by: Conduent Healthy Communities Institute
Last update: May 2022
Compared to

Graph Selections

Data Source
- Illinois State Police
Maintained By: Conduent Healthy Communities Institute (Methodology)
Filed under: Community / Crime & Crime Prevention, Teens